Internal financial dashboard for Hackerspace Gent (0x20) board members. Tracks bar tab balances, membership payments, and the treasury.

Security

Financial data is sensitive. The dashboard never reaches the open internet, it is only accessible on the hackerspace LAN (board-financials.lan.0x20.be).

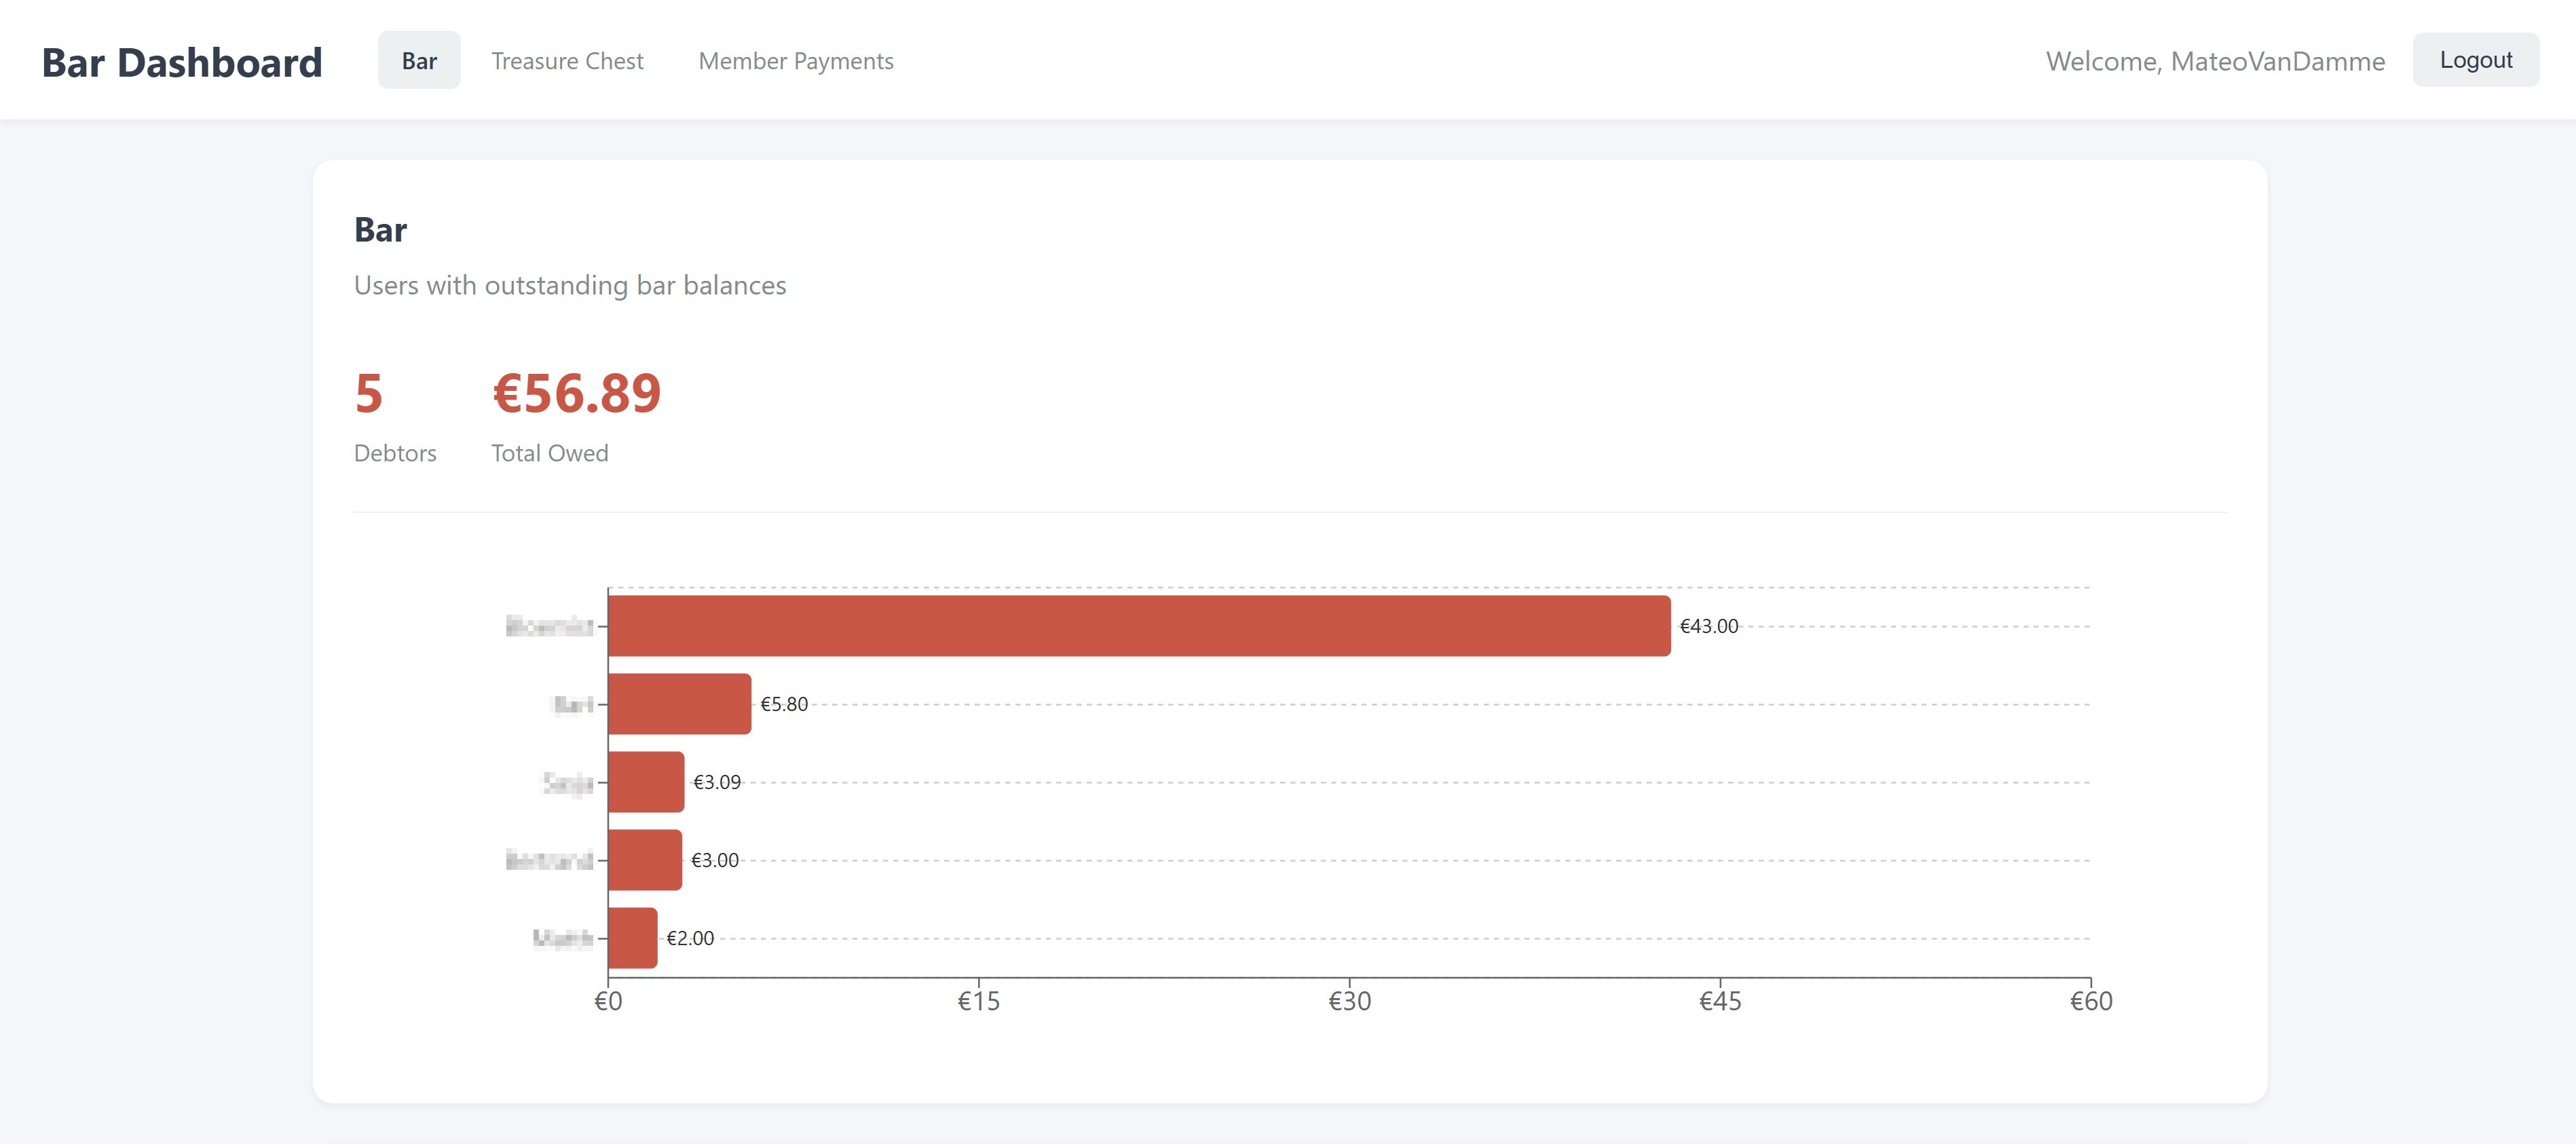
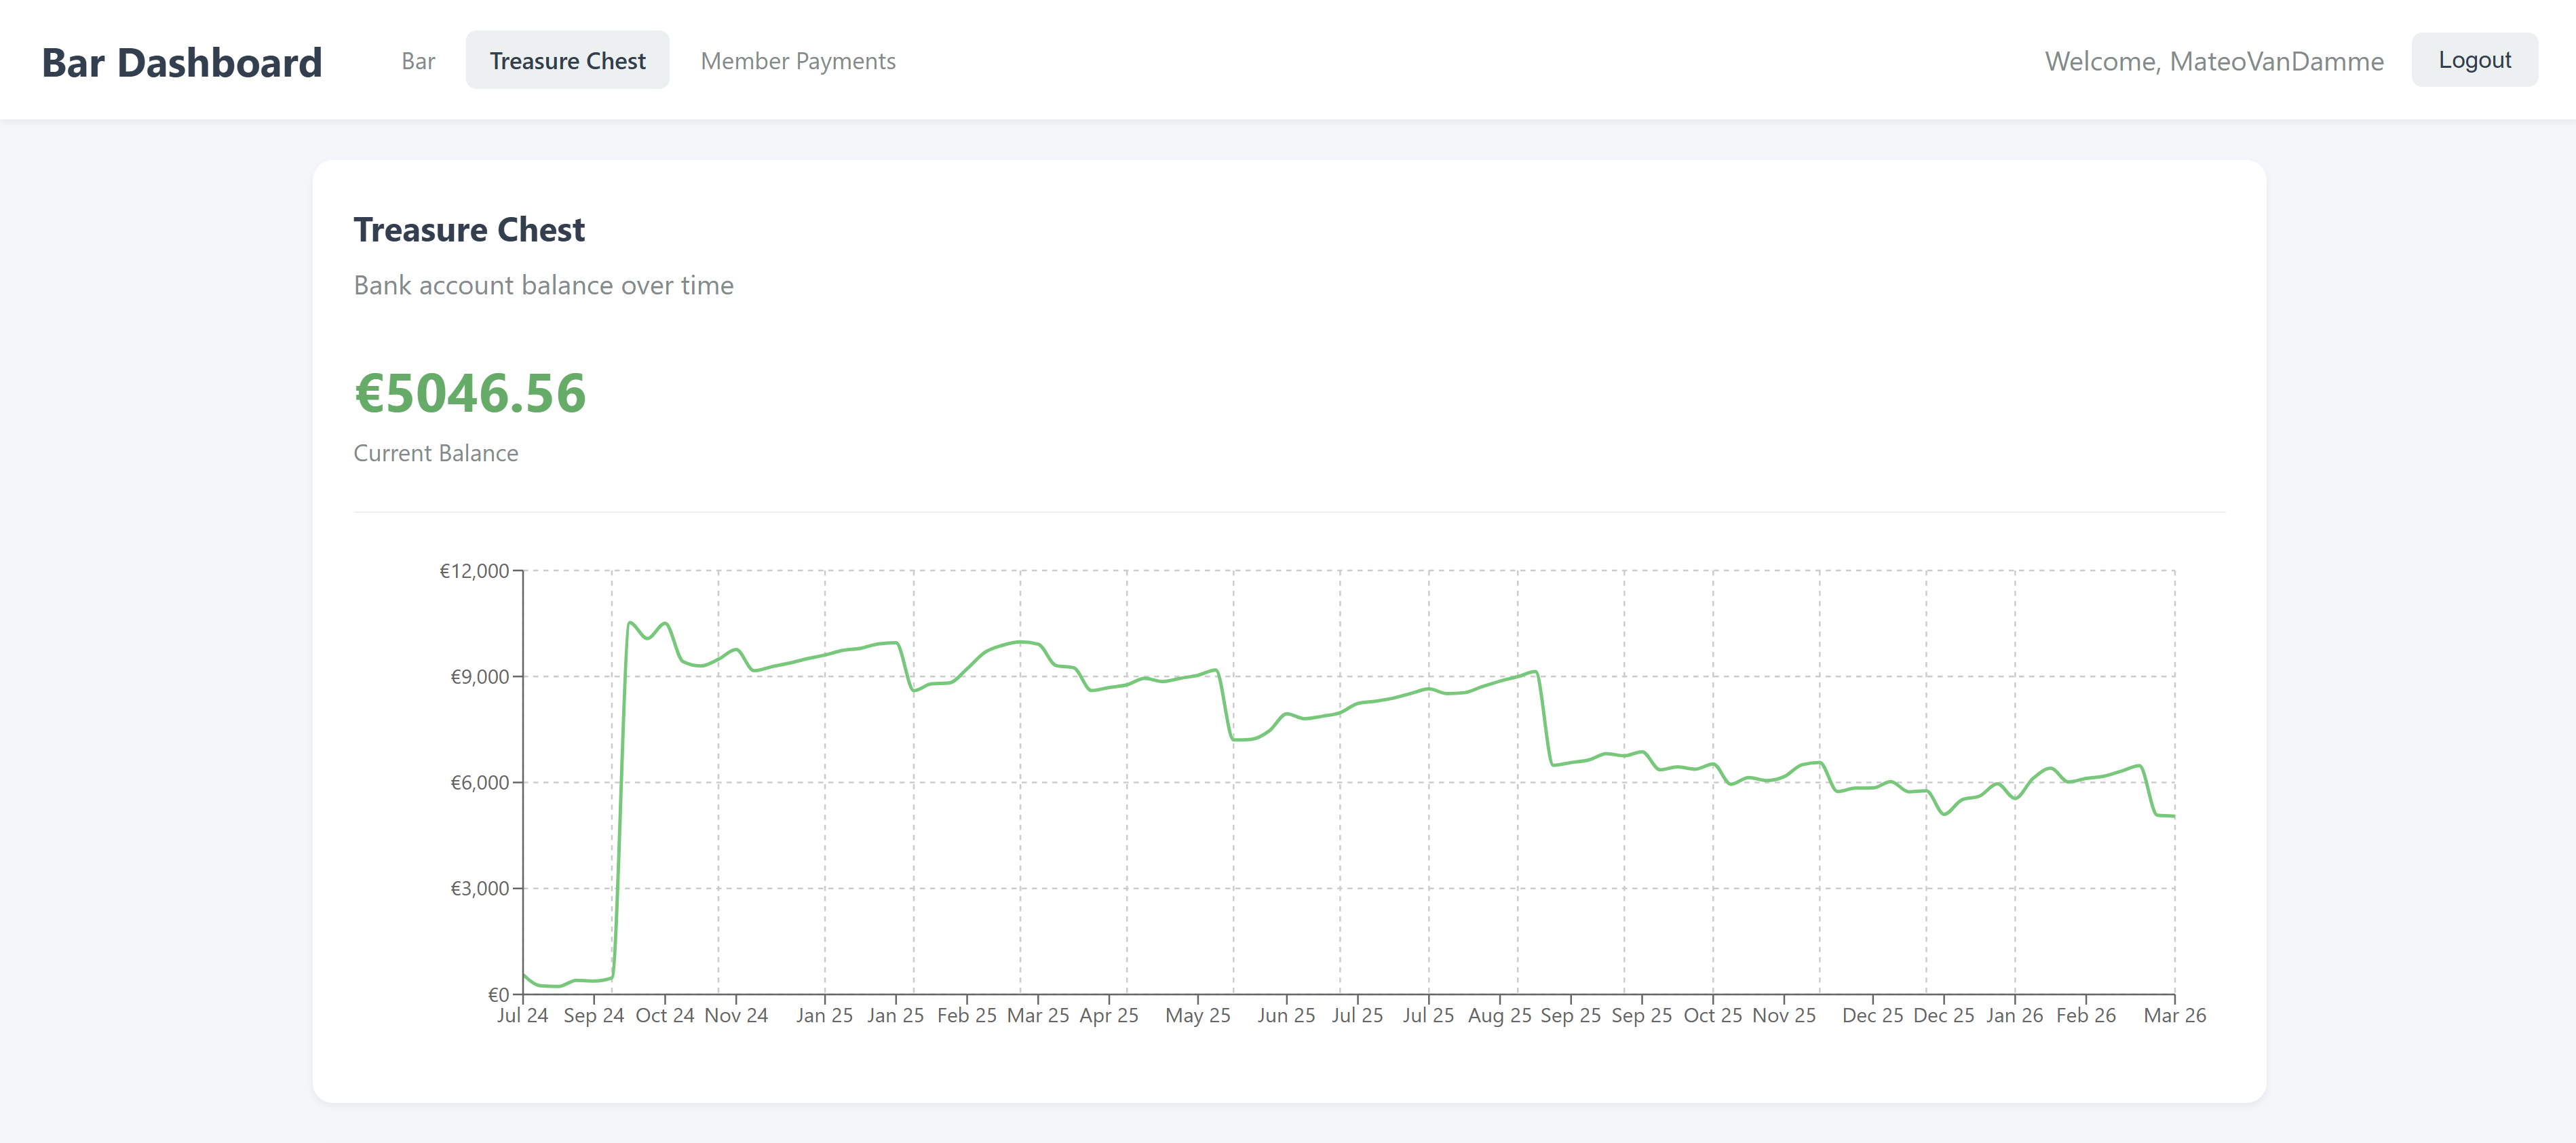
Data comes from two sister repos: bank exports (bank-reporting, private) and the bar ledger (tab-data, public). Sensitive data is never committed, it lives on the server directly.

All sensitive pages are behind GitHub OAuth. Board members authenticate with their GitHub account via OAuth2. The backend issues a signed JWT after the OAuth callback, which is verified on every API request.

LAN-only not reachable from the internet
GitHub OAuth board allowlist only
JWT signed tokens, verified on every request
Docker isolated containers, no raw port exposure
Architecture
Backend
FastAPI Python
pandas data parsing
Frontend
React + TypeScript
Vite build tooling
Recharts visualisation

Infrastructure
Docker Compose frontend + backend containers
Nginx reverse proxy and SPA routing
Cron data synced every 10 minutes
PythonReactViteDocker
Bar tab debtors view
Bar Tab

Members run a tab at the bar using a custom beancount ledger. The dashboard reads bartab.beancount from tab-data and shows who owes what and general spending habits.

Beancount open-source plain-text double-entry ledger
Member payment heatmap
Members

Payment heatmap showing which members are up to date with their membership dues. Each row is a member, each column a month. Green means paid, red means overdue.

Names are visible only to board members on the internal LAN. This screenshot is censored.

Heatmap per member, per month
Private board-only view
Treasure Chest

Bank balance over time as a line chart, income vs. expenses by category, and a yearly expense breakdown as a pie chart with a year selector. Categories include membership, bar, rent, utilities, and more. pandas parses and categorises transactions using keyword matching.

pandas transaction parsing and aggregation
Recharts line chart, bar chart, pie chart
Year selector compare across years
Space TV display
Space TV Display

One unauthenticated endpoint (/tv) shows the space stats on the TV in the hackerspace. No login required, it only exposes two aggregate numbers, nothing sensitive.

Active members is derived from the payment heatmap for the last completed month. Snacks bought is the beancount ledger summed for the current month.

Public no auth, no personal data
FastAPI dedicated /public/stats endpoint